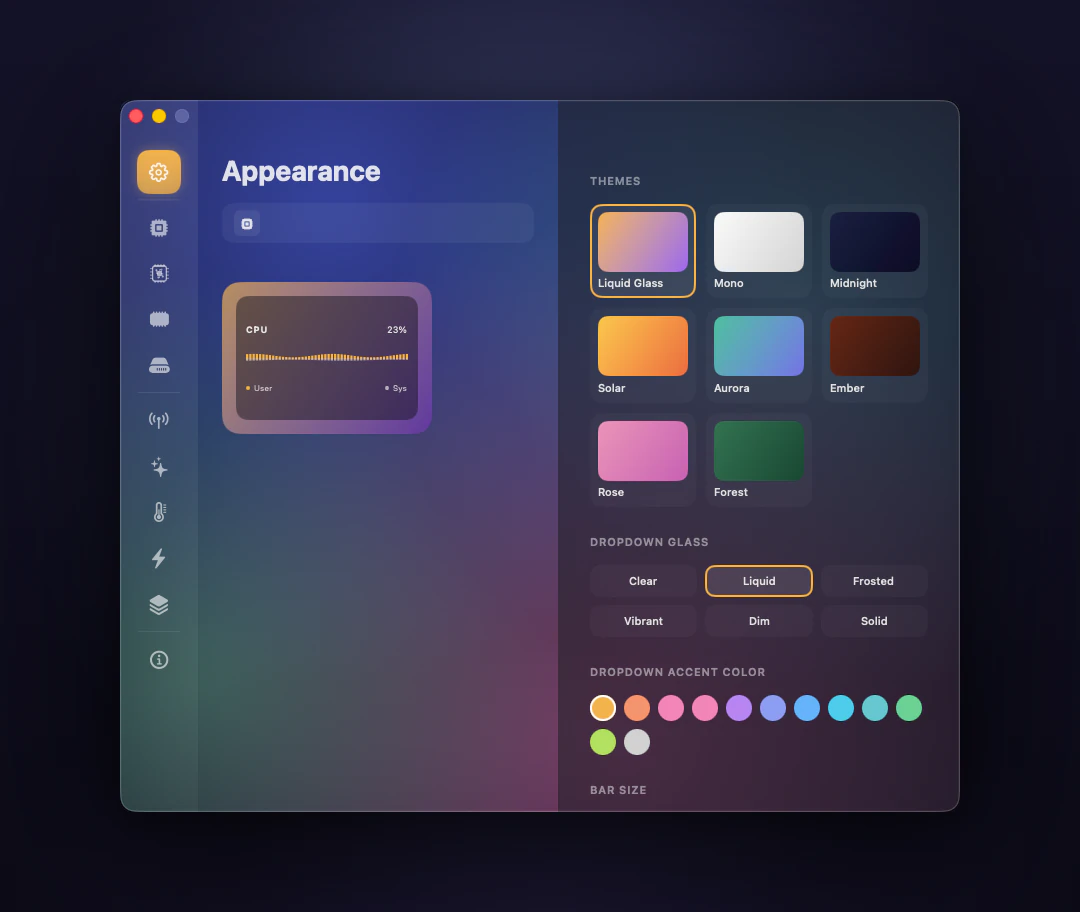
Every metric, its own item
Show the ones you care about, drop the rest, and reorder them to taste. Each item carries its own live readout in the bar — no dropdown needed for a glance.

macOS · Menu-bar system monitor
Operator puts CPU, GPU, memory, disk, network, battery, sensors — even your AI usage — in the macOS menu bar, each as its own status item. Click one and a liquid-glass dropdown opens with sparklines, gauges, and the processes behind the number.
macOS 26+ · 14-day free trial · Secure checkout
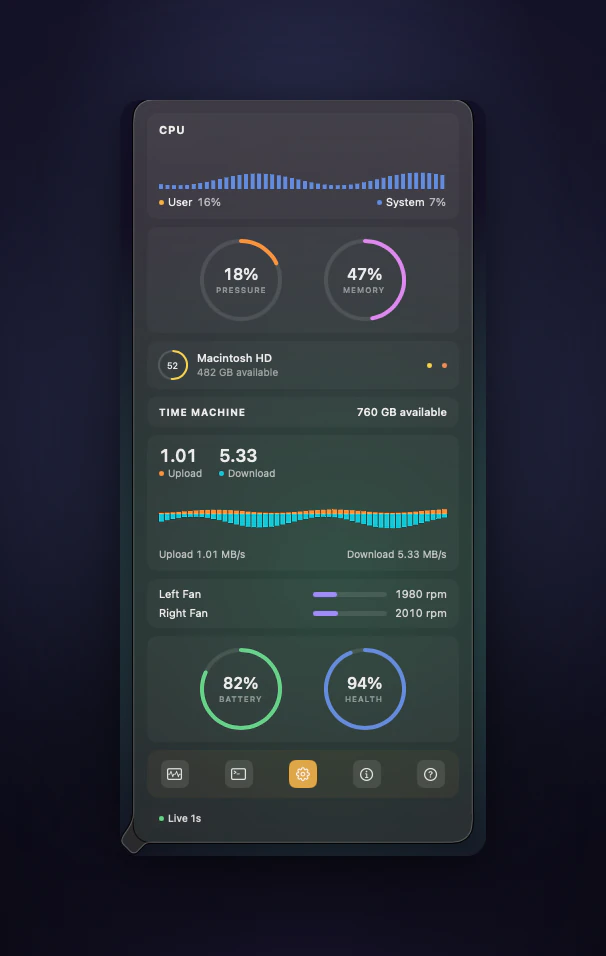
Show the ones you care about, drop the rest, and reorder them to taste. Each item carries its own live readout in the bar — no dropdown needed for a glance.
Operator reads local Claude and Codex transcripts plus provider usage endpoints — sessions, tokens, cost, and streaks, right next to your CPU.
Live process lists ranked by appetite, so you can see who is eating your CPU, memory, disk, or network the moment it happens.
Temperatures, fan speeds, power draw, voltage, clock frequency, even display backlight — read by an optional privileged helper, which also unlocks SMART disk health and per-process network.
Dim the display straight from the GPU dropdown, or flip on keep-awake for a long render. The controls sit next to the numbers they affect.
Wi-Fi signal, VPN state, ping, public IP, display FPS — plus battery health, cycle count, and the charge left in your Bluetooth gear and AirPods.
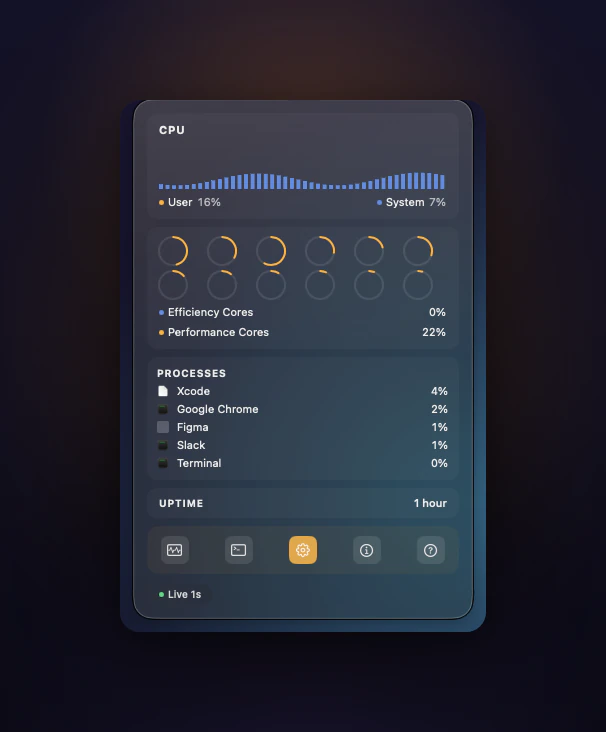
CPU & processes
Per-core load split across efficiency and performance cores, a live process list ranked by who’s eating your CPU, plus uptime. The menu bar shows the number; the dropdown shows why.
Personalize
Choose what each status item shows and which cards live in its dropdown. Bind global hotkeys, flip on launch at login — and when you care how it looks, six glass materials, themes, and full accent control are in there too.